Analysis using R
Boxplot of Pre-primary Age Male Out-of-School Rates by Continent

Polar Chart Average Pre-primary Female Out-of-School Rates by Continent
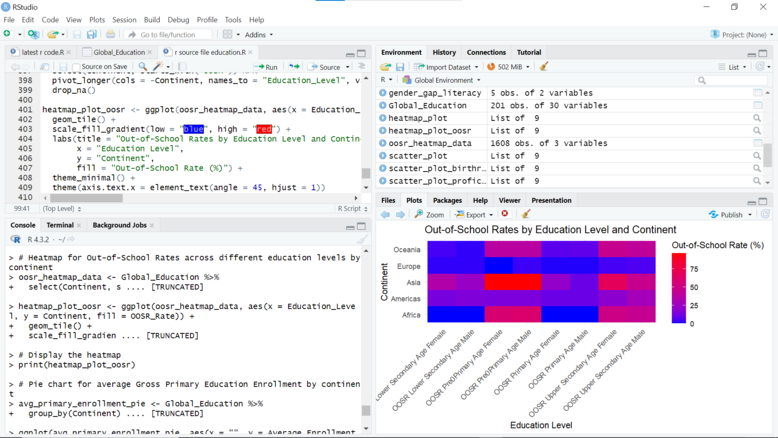
A heat map of Out-of-School Rates by Education Level and Continent
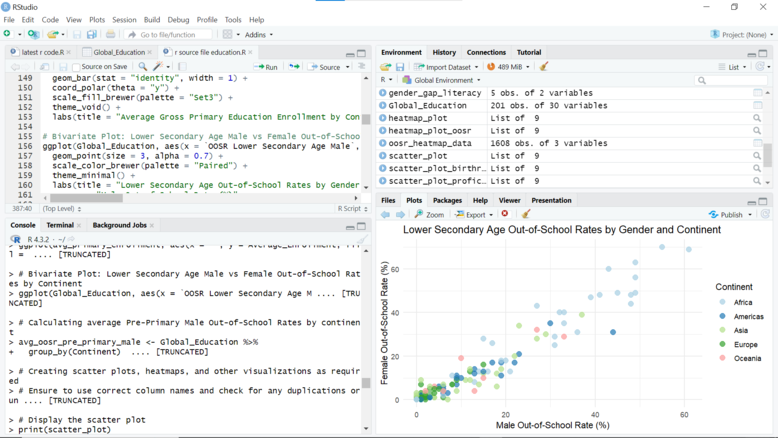
A Bivariate Chart of lower Secondary Age Out-Of-School Rates by Gender and Continent